No man ever steps in the same river twice, for it’s not the same river and he’s not the same man (Heraclitus)
It is hard to argue with Heraclitus, but rivers do have common characteristics. This matters when it comes to developing rating curves. Recognizing specific rating types makes it easier to get good water data.
Few people consider “the rating curve” an exciting topic; nevertheless, they are important because they have a huge impact on the quality of water data, and by extension on the effectiveness of water resources allocation and management decisions. Developing accurate rating curves is more difficult than most people—including quite a few hydrologists—realize because rivers are dynamic and discharge measurements are often scarce.
For this reason, the most effective approach to developing rating curves is to combine streamflow data with the hydraulic parameters of the river. This is referred to as the ‘hydraulic approach’. Channel characteristics suggest the shape of the rating curve. The curve is then calibrated with a small set of high-quality discharge measurements.
In this process, the key to developing a good rating curve is to understand the hydraulic conditions of the control at the measurement site.
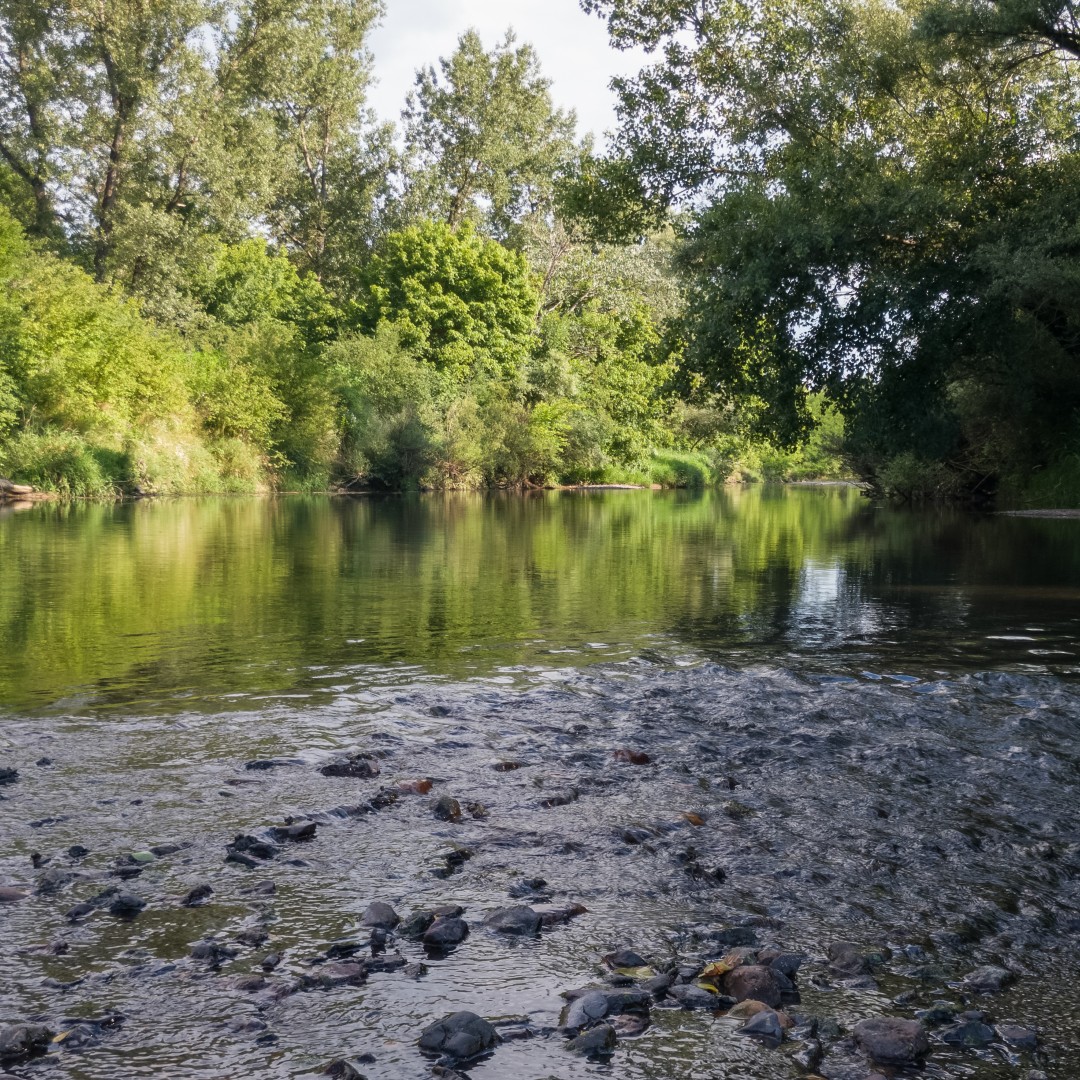
Understanding control conditions – a riffle in the middle reach of a river with a distinct lean season
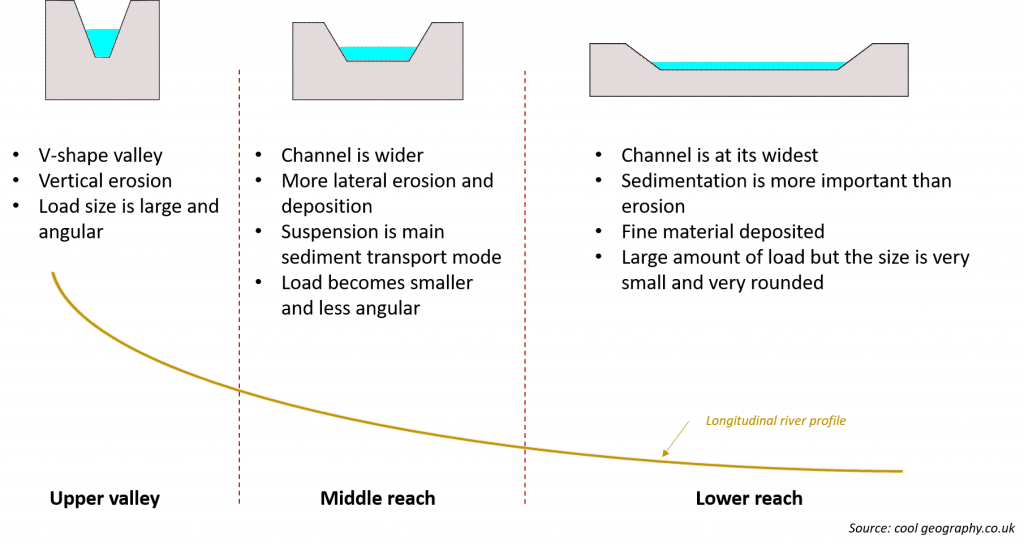
The longitudinal river profile of a typical middle reach is still uneven and consists of segments with smooth banks and low gradients, alternated by small rapids caused by some obstacle such as large rocks or rock outcroppings.
For this rating type, the climate is characterized by a bi-modal rainfall regime with distinct dry and wet seasons—a common climate in the tropics. The river responds quickly to a rain event and floods are high, but baseflow in the dry season is steady and low.
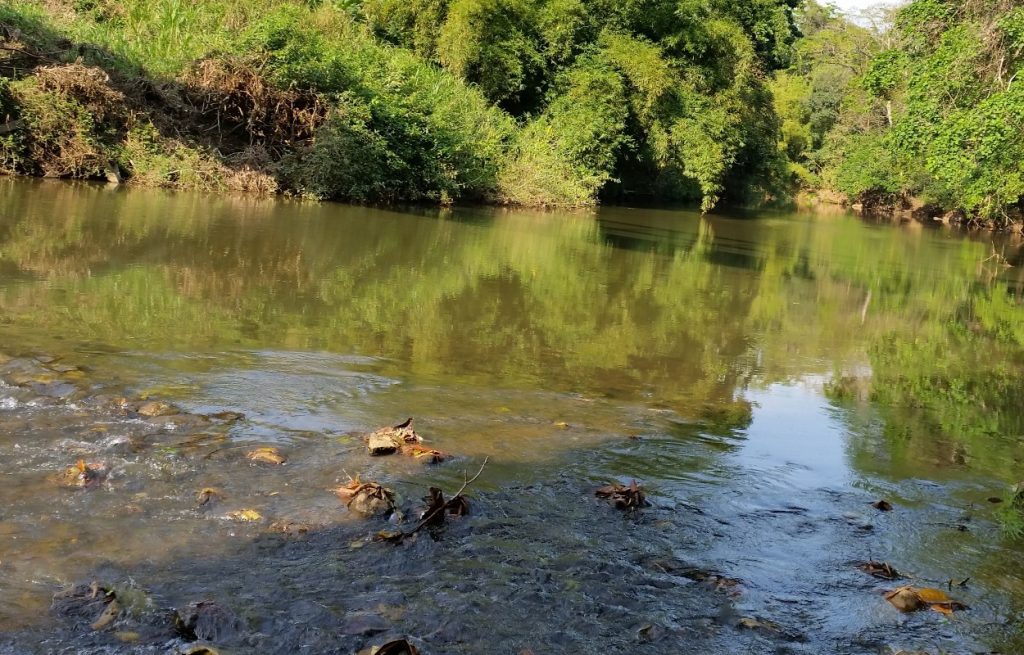
In this case, low flows are controlled by a riffle made up of large pebbles and cobbles. It is a common situation. During high flows, the riffle is submerged but in the lean season it creates a level gauge pool with almost zero approach velocity. Because stage is now a direct measure of water depth over the control (i.e., the riffle), it is an ideal site for flow measurements.
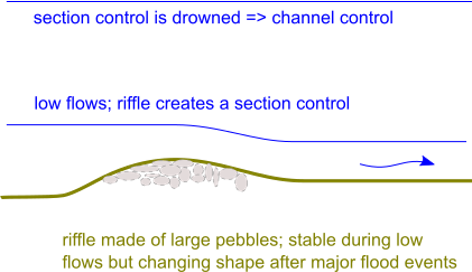
The critical point is the stability of the riffle. It is very stable during low flows but can change dramatically during a flood. Hence the low-flow segment of this rating curve is stable during the entire low flow season but changes with every flood season. That is a point to keep in mind. It compels us to develop a new low-flow curve for each and every dry season.
Note that when the riffle is submerged, flow conditions transition from section to channel control. It leads to a rating curve with at least two segments.
What does it mean?
After a major flood has rearranged the pebbles and changed the riffle, the low-flow curve of the previous season is no longer valid; the changes are just too big and random, and a gradual shift has no meaning. We therefore need to re-establish the low flow curve for every lean season.
By contrast, if the river at the rapid is anchored by large rocks—which is often the case for this rating type—the mid and high flow segments of the rating curve are very stable. It can be difficult to measure floods, but once the rating curve has been defined, it remains valid for many years and can probably be used retro-actively.
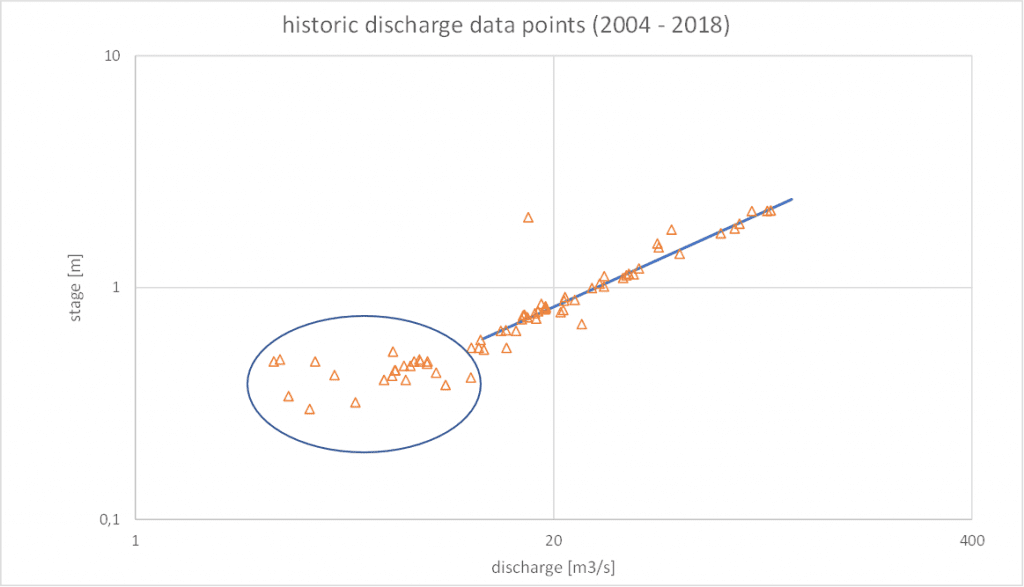
This is illustrated in the below plot the of historic discharge measurements (note: in log-log space). While a stable mid and high flow segment can be distinguished, the scatter in low flows points to an unstable control. Discharge measurements were conducted with a propeller-based current meter, which explains some of the inaccuracy of the data.
Measurement program
The measurement program for this control has two distinct components. The first is concerned with measuring floods and high flows. This is difficult and will require a dedicated effort, with a team staying onsite until a flood has been measured. But once the high flow segment of the rating curve is established, very few additional flood measurements are needed.
The second component of the field program focuses on re-establishing the low-flow rating curve after every flood season. A few routine low-flow measures are needed during every lean season. Note that these measurements can be conducted at any time during the low-flow season since the curve will remain stable until the next flood.
| SEGMENT | RATING CURVE STABILITY | FIELD PROGRAM |
| Low flow segment | Very stable during the dry season Can change drastically after an extreme flood Low flow segment differs from season to season Can not be inferred retro-actively (after flood) | Re-establish for every dry season Can be estimated at any point during the season Curve remains valid for the entire dry season |
| Mid and high flow segment | Stable when anchored by rocks Rating curve remains valid for many years Can probably be used retro-actively | Measuring floods is difficult and requires a special effort But only few extra measurements are needed after the high flow segment is established |
Recap
This post reiterates one of the key themes of this blog that developing good rating curves starts with observing and understanding the hydraulic characteristics of the control.
And keep in mind that improving the rating curve is often the most effective step to improve the quality of river flow data.
Contact Bart Hilhorst (hilhorst@fireflybay.com) if you wish to learn more about the hydraulic approach to rating curve development. He has extensive experience in using the methodology to improve the quality of (historic) discharge time series and optimize field measurement programs.