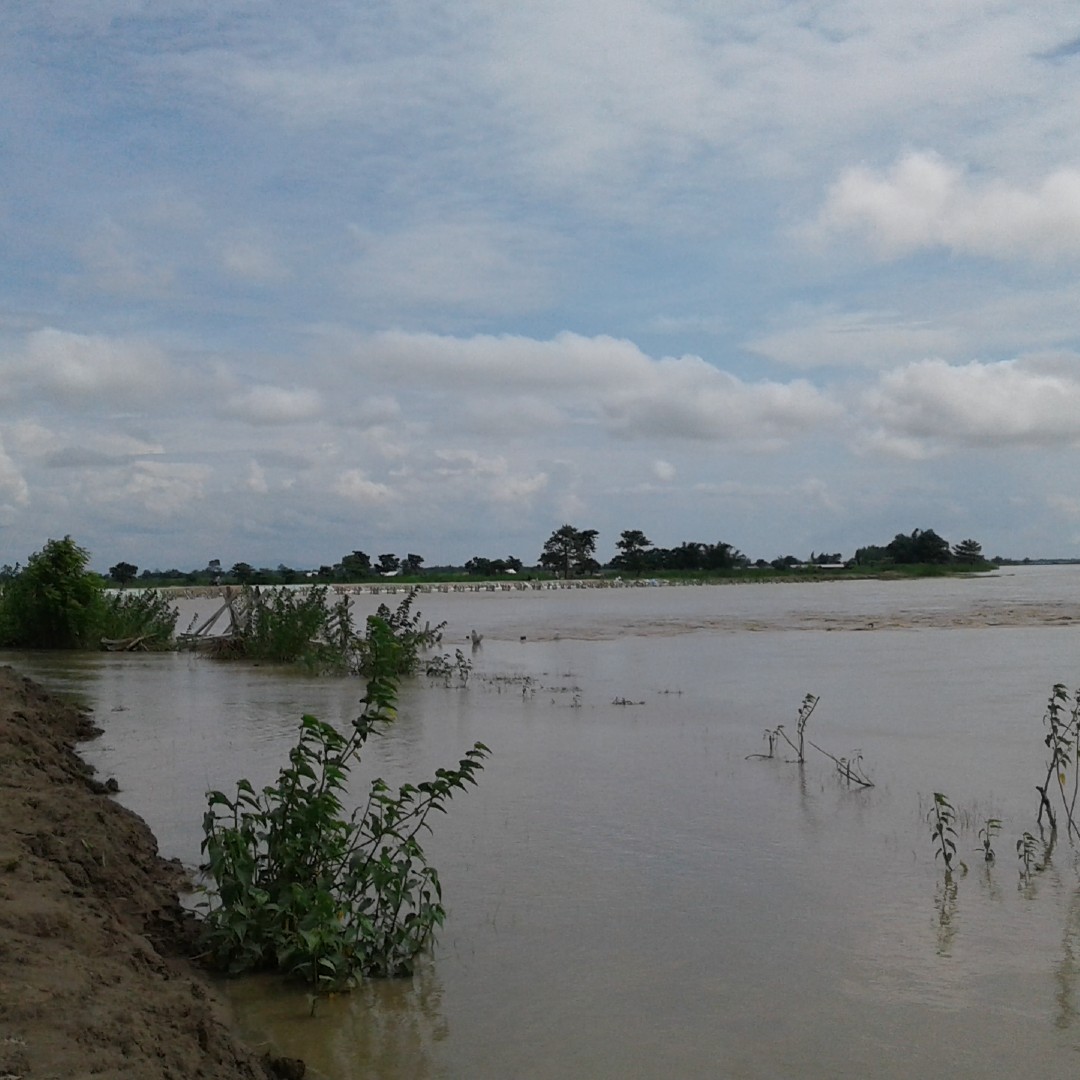
Can we predict extreme floods? It is a question that returned to my attention when we proposed geotextile tubes as flood defenses along the Shabelle in Somalia.
Some background: because of the inverse topography of the riparian zone—where the river is above the surrounding land—embankment breakage must be avoided at all costs since it would inundate a very large area for many weeks or longer. At the same time, it is unlikely that enough funds can be mobilized to prevent flooding for all river levels and flood volumes. It is probable that occasional bank overtopping will occur.
Note that it is unlikely that nature-based solutions in the upstream catchment will have much impact on the flood peak in the short and medium term. Further, the ‘room for the river’ approach cannot work because of the inverse topography.
That is why we proposed geotextile tubes (along with other measures such as rehabilitation of off-stream storage reservoirs, flood relief canals, and others). Geotextile tubes address three main mechanisms that cause embankment collapse: incremental erosion, stability failure, and seepage. In addition, the tubes can accommodate the incidental overtopping that is anticipated.
But there is a caveat. Some overtopping may be possible but not too much. That is why I wanted to have a look at the flood statistics.
Why is flood prediction so difficult?
There are not enough data: a proper flood analysis requires a discharge time series of 50 years or longer. For extreme floods—with a return period of a hundred years or more—the streamflow record should ideally be longer. Yet for many rivers there is no continuous record set of this length. The statistical parameters produced by the flood analysis, therefore, probably do not represent the actual hydrologic regime of the river—specifically not at the extremes.
Inaccurate data: peak discharge—the parameter at the basis of the statical flood analysis—is often of questionable quality since few rivers have an accurate rating curve for floods. Flood measurements are difficult while hydrographers are rarely on site during the peak of the flood. In addition, floods typically spill over the riverbanks, causing all kind of hydrometric complications. Most peak floods, therefore, are estimated and subject to (very) substantial errors.
Changes in rainfall-runoff process: many things happen in a landscape in a period of 50 years or longer. Growing populations cause land-use changes: forests being converted to agricultural land, expansion of build-up areas, land degradation, etc. Reservoirs—including small ones—and river training infrastructure may have been established. The dominant rainfall-runoff mechanisms of 50 years ago are probably different from what they are today. These changes continue. It poses the question: to what extent is a hydrologic regime that represents the past still valid in the future?
Climate change: extreme rainfall is among the principal drivers of a flood event. We know that the climate is changing but we do not know how much and how fast. Note that the impacts of climate change are non-linear with many things happening ‘at the extremes’. Hence, we do not really know what future extreme rainfall will be.
Thus, statistical analysis of historic time series is often inadequate to predict future flood events. This is specifically the case for the Shabelle river because of the absence of good water data in combination with ongoing land degradation in the upstream catchment. Besides, the construction of Melka Wakena reservoir in 1988 has complicated the hydrologic analysis.
What to do?
Regional Process Hydrology
You have to understand the dominant flood mechanism in order to manage the flood
Alongside runoff data, fortunately, there is other information to investigate the flood regime of a river. These include climate and catchment characteristics. By examining climate, rainfall-runoff mechanisms, river routing, and human interventions it is possible to infer flood behavior. At basin scale this is referred to as ‘regional process hydrology’, which links the understanding of hydrological processes in small catchments to larger scales.
For instance, while catchment response—that is the rainfall-runoff process—dominates flood characteristics at small scale, at larger scales they are determined by the spatial scaling of precipitation and river routing.
This is reflected in the below figure, which compares typical flood frequency curves for a small and a very large catchment. The flood frequency curve is a statistical tool that provides a measure of how often a flood of a given discharge occurs. It is a subset of the full spectrum of runoff variability.
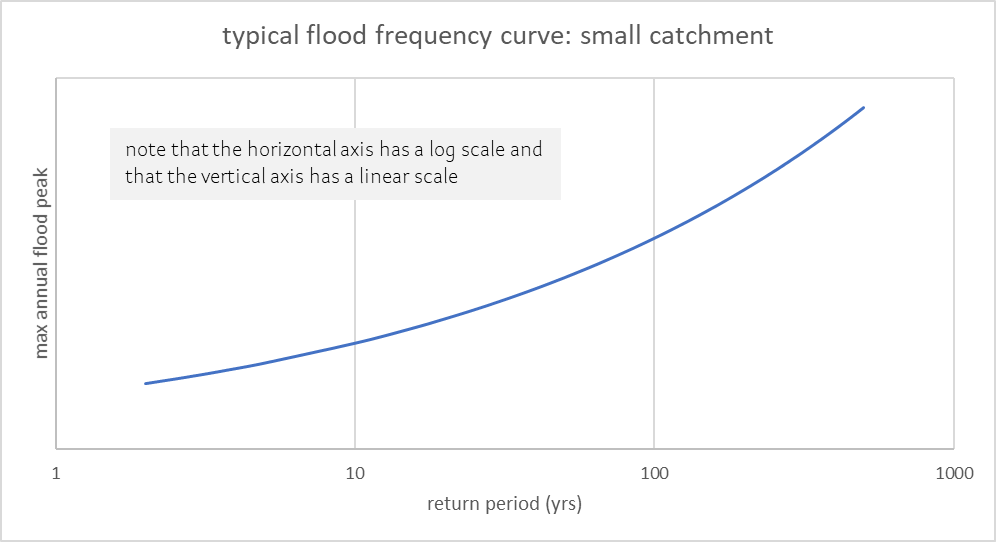
The convex shape of the flood frequency curve for small catchments is caused by the short concentration time and a threshold with regard to storage of rainfall in the landscape. Once storage space is full—in the soil or in small depressions—the dominant runoff mechanism typically changes, and a larger area of the catchment contributes to direct (surface) runoff.
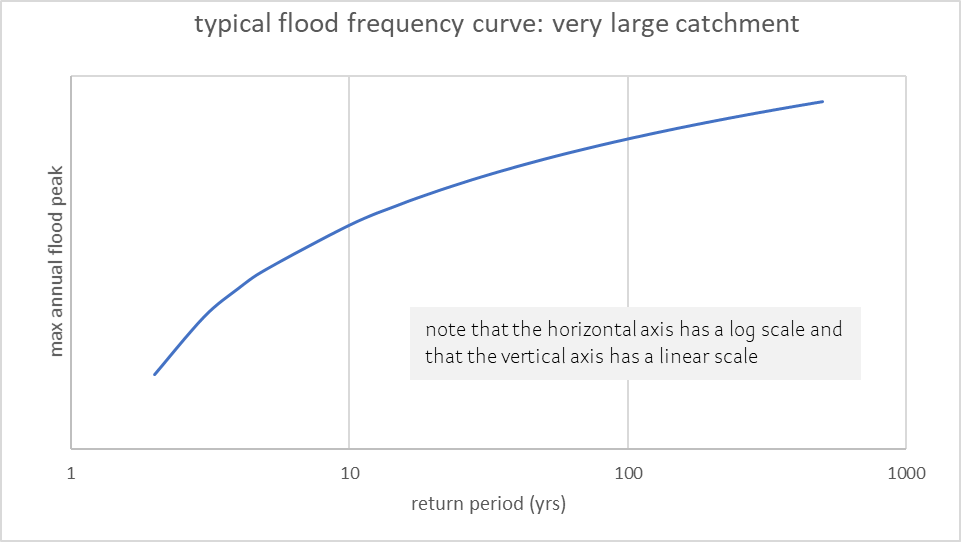
By contrast, it is unlikely that the entire area of a very large catchment contributes to runoff because of general heterogeneity of the landscape and the uneven spatial (and temporal) distribution of rainfall. Different tributaries will have different response times and runoff routing over long distances further dampens the flood peak. It results in a concave shape of the flood frequency curve.
In small catchments, the flood frequency curve may be governed by the catchment response and at larger scales by the spatial scaling of the precipitation
Floods in the Lower Reach of the Shabelle
The Shabelle—with a catchment of about 190,000 square kilometers upstream of the hydro station at Beledweyne—clearly classifies as a large basin. Most rainfall occurs in the upstream parts of the catchment because of orographic processes. The distance between Beledweyne and the most remote point in the watershed is some 850 km, leading to a concentration time of 4 to 5 days or more. Channel losses will occur that further dampen the flood wave. In addition, a large reservoir such as Melka Wakana tends to reduce runoff variability. While we have no information on the operating rules, we do know that the reservoir is mainly used for hydropower production. Moreover, flood peaks are further delayed and attenuated by local geological conditions at Mustahil—just upstream of the Ethiopia-Somali border. The flood regime of the Shabelle at Beledweyne, therefore, is probably represented by the concave shape in figure b.
Mustahil
Local geological conditions at Mustahil—some 40 km upstream of the Ethiopia-Somali border—have confined the Shabelle river to a single narrow channel without a floodplain. It has reduced the hydraulic capacity of the river for high flows and causes the water surface to back-up towards the upstream during floods. It has created an upstream alluvial area some 50 km in length and 10 km in width. This backwater zone inundates during floods. It therefore captures the flood wave and attenuates the downstream hydrological regime of river Shabelle.

Do geotextile tubes represent a feasible option for the Shabelle?
We need to have a better look at the data—and quality control the data—but I think we are on the right track.
Peak water levels will be constrained by the concave shape of the flood frequency curve in combination with the exponential increase in hydraulic capacity of the Shabelle with rising water levels, as well as bank spill (intended or accidental). Thus, geotextile tubes are a feasible solution in this environment and they are probably part of the pallet of options to protect the low-lying lands along the Shabelle in Somalia from prolonged flooding.
Since it is likely that some bank overtopping will occur (if only out of necessity), it represents a hybrid of a ‘techno solution’ and a ‘nature-based solution’. Note that we can determine the river reach (or location) where bank spill occurs and direct this water to areas where it can be stored or infiltrated to the groundwater, or away from areas with valuable economic activities or infrastructure.
Focus on damage mitigation and productive use of water that has spilled rather than flood prevention.
Note 1: Other options to prevent flood damage will include normal levees, off-stream storage, flood relief canals, enhanced riparian buffers along the river, solid waste management, measures to prohibit (and remove) riverbank encroachment, measures to prevent people living in very low areas subject to prolonged inundation, etc.
Note 2: I presume most people involved with the Shabelle will agree on the most urgent follow-up actions:
- Review the rating curve for the hydro station at Beledweyne; apply ‘forensic hydrology’ to infer this curve—with some level of accuracy—for specific years in the period 1960 to present (say every 10 year); subject the resulting discharge time series to a systematic QAQC exercise and assess the level of confidence we can have in these data
- Get a high-resolution LIDAR scan for the entire riparian zone
- And, ideally but maybe not possible right now, review the release data for Melka Wakana and a downstream hydro station on the main stem of the Shabelle in Ethiopia.
References
Runoff Prediction in Ungauged Basins: Synthesis across Processes, Places and Scales; Günter Blöschl et al, Cambridge University Press, 2013
Günter Blöschl, “Breakthroughs in Flood Research”; lecture for the Global Institute for Water Security (GIWS), Saskatchewan, 2016
Hannah Cloke, “Preparing for Floods”; lecture for the Global Institute for Water Security (GIWS), Saskatchewan, 2021