
Measuring flood flows is tricky. It’s difficult to have a team of hydrographers on site during the peak of the flood. But even if you manage to be present with all the equipment, against the odds, it remains a challenging undertaking. After all, how do you (safely) measure this wild torrent?
Nevertheless, flood statistics are needed to design flood defenses and infrastructure such as bridges, culverts, and water diversion structures.
A video of the flood event—when combined with a conceptual understanding of the hydraulic conditions at the station—can be useful. This post presents an example.
Conceptual understanding of El Piro Hydro station
El Piro hydro station is in the middle of the city of San Salvador. El Piro river functions as a drain that collects storm runoff from large, paved urban areas. The response to a rain event, therefore, is quick and peak flow can be huge.
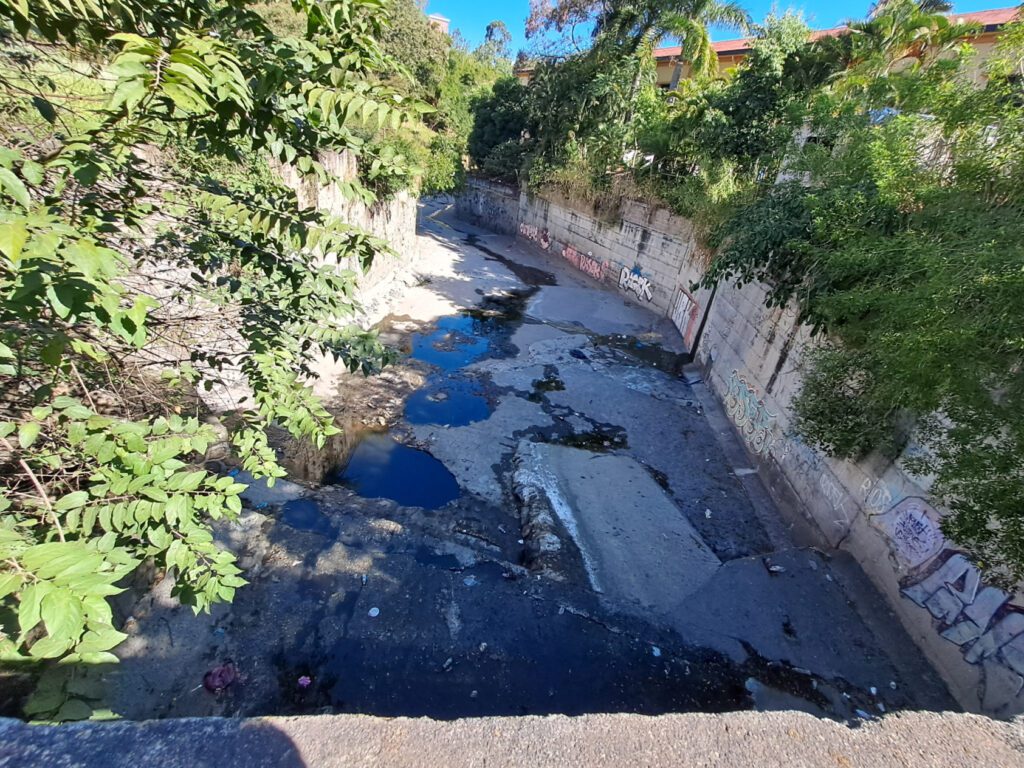
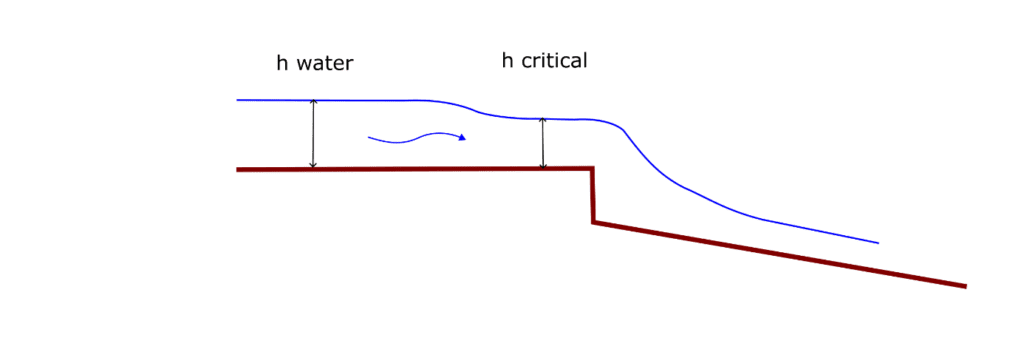
The picture above shows El Piro immediately downstream of the measurement site (as you might already suspect, this photo was taken in the dry season). It’s a bit difficult to see, but there is a sudden perpendicular drop—of more than 1 m—in the concrete-box-like-channel, just downstream of the bridge from where this photo was taken. This drop forms the hydraulic control. The channel, therefore, is subject to ‘section control’ for the entire range of water levels observed—from low flows to flood flows. This is conceptually presented in the below figure.
This is an excellent monitoring site in principle. Section control implies ‘critical flow’ at the hydraulic control (in this case: ‘the sudden drop’). It means there is a unique relation between stage and discharge. The bridge provides a safe and convenient location from where to conduct a measurement. The rating curve is stable and can be extrapolated because of the concrete channel. Thus, the site fulfills all requirements for a good rating curve and, by extension, for a good hydro station that produces defensible water data.
The above schematic implies a single-segment curve that represents the entire range of flow, and that is also very stable because of the concrete-box conditions of the channel.
In reality there are some minor irregularities in the concrete channel-walls immediately upstream of the bridge—which probably affect the flow area for low flows—and we may have a separate low-flow curve. But that’s a detail for now and does not affect the point I wish to make in this post.
Post event analysis
Below are two videos of a major flood event.
The first video shows the river immediately downstream of the measurement site. We are dealing here with super-critical flow conditions. It’s simply impossible to measure this flow. There is just too much turbulence to use an ADCP or any other instrument.
Video 2 was taken almost at the same time as video 1 and represents the same flash flood event. One can clearly see the starting point of the critical flow conditions (@ 00:00:15). While the river is still wild, it is far less turbulent relative to the torrent further downstream. It confirms the conceptual model introduced above, in which sub-critical flow transfers to critical a short distance upstream of the hydraulic control. It subsequently becomes super-critical below the sudden drop in the channel floor (see the first video).
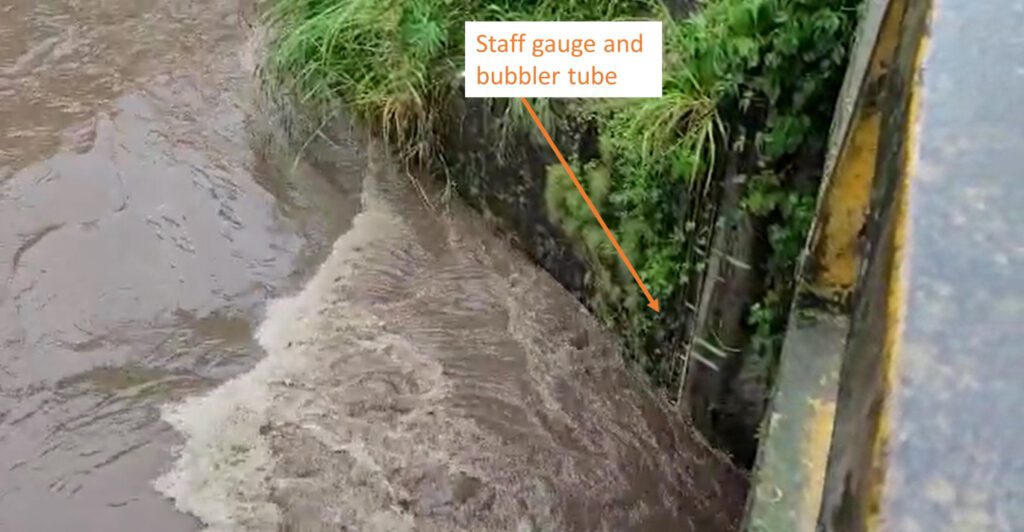
The video also reveals that the water level recorder is incorrectly positioned. The hydro station is equipped with a Compact Bubbler Sensor and the bubbler tube and staff gauge are placed immediately upstream of the bridge, as seen in the below still frame. At this point, however, flow is already transitioning to critical and the water level at this point does not represent the specific energy of the river. The level recorder, therefore, needs to be moved a few meters further upstream. This can be accomplished with a radar sensor mounted from the bridge.
An additional argument to replace the bubbler is that it does not produce accurate water level measurements during flood flows according to the water agency in El Salvador. I think this may have to do with the fact that flow is already transitioning to critical at the water level monitoring site during floods.
Calibrating the rating curve
The formula below shows the ‘standard rating equation’ that is the corner stone of the hydraulic approach to rating curve development.
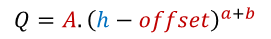
Those familiar with this approach know that we’re probably dealing with a single-segment rating curve (except for very low flows). Because of the concrete channel, the values for “offset”, “a”, and “b” can be estimated a-priori and will remain virtually stable. The coefficient “A” needs to be calculated but should also remain stable, although it could change a little with increasing water levels (in which case we need to add a breakpoint and a new segment to the rating curve). Thus, a comparatively small set of good quality discharge measurements—preferably including several minor flood events—should suffice to calibrate this rating curve.
The above assumes that the water level recorder is moved to a location a few meters further upstream.
What to do with the historic data?
I expect that water levels for low, mid, and probably even heigh flows have been accurately recorded at the current monitoring site. I also think that the current rating curve—for the above flow conditions—is valid for the historic data. After all, the concrete-box-like-channel is very stable.
Unfortunately, flood levels have not been accurately recorded because the bubbler did not work properly and because it was situated in the wrong location. Thus, the existing flood record set cannot be used for flood analysis. There is nothing that can be done retro-actively to correct these data points. We therefore have a historic time series of discharge data at El Piro without information on floods. It is the way it is.
| The hydraulic approach to rating curve development This methodology uses field observations of channel properties to suggest the shape of the rating curve and make an initial assessment of its coefficients. The curve is then calibrated with historic and current discharge data points. It results in a conceptual rating model that corresponds with the hydraulic characteristics of the control section and is therefore robust and very stable. This methodology is specifically suited for a data scarce environment. Often, water agencies lack the financial resources for an intensive field monitoring program, and most hydro stations are visited only a few times per season. For these conditions, employing a data intensive methodology such as HEC RAS is not realistic while statistical curve fitting is too arbitrary. Moreover, extrapolation of the curve—based on the hydraulic approach—is justified for the range explained by the conceptual model. This short video presents a concise introduction to the approach. |