Researchers continue to investigate new methods to develop better rating curves. Examples are Vatanchi and Maghrebi (2024) and Johnson et all (2024). It underscores the importance that water managers assign to good quality water data and the realization that the rating curve approach remains useful for many hydrometric stations.
How do these new methods compare with the “hydraulic approach”? (go to the end of this post for a synopsis of the hydraulic approach)
This post will present some thoughts on sophisticated statistical methods for developing rating curves, assess when statistical methods are applicable, and compare them to the hydraulic approach.
The context
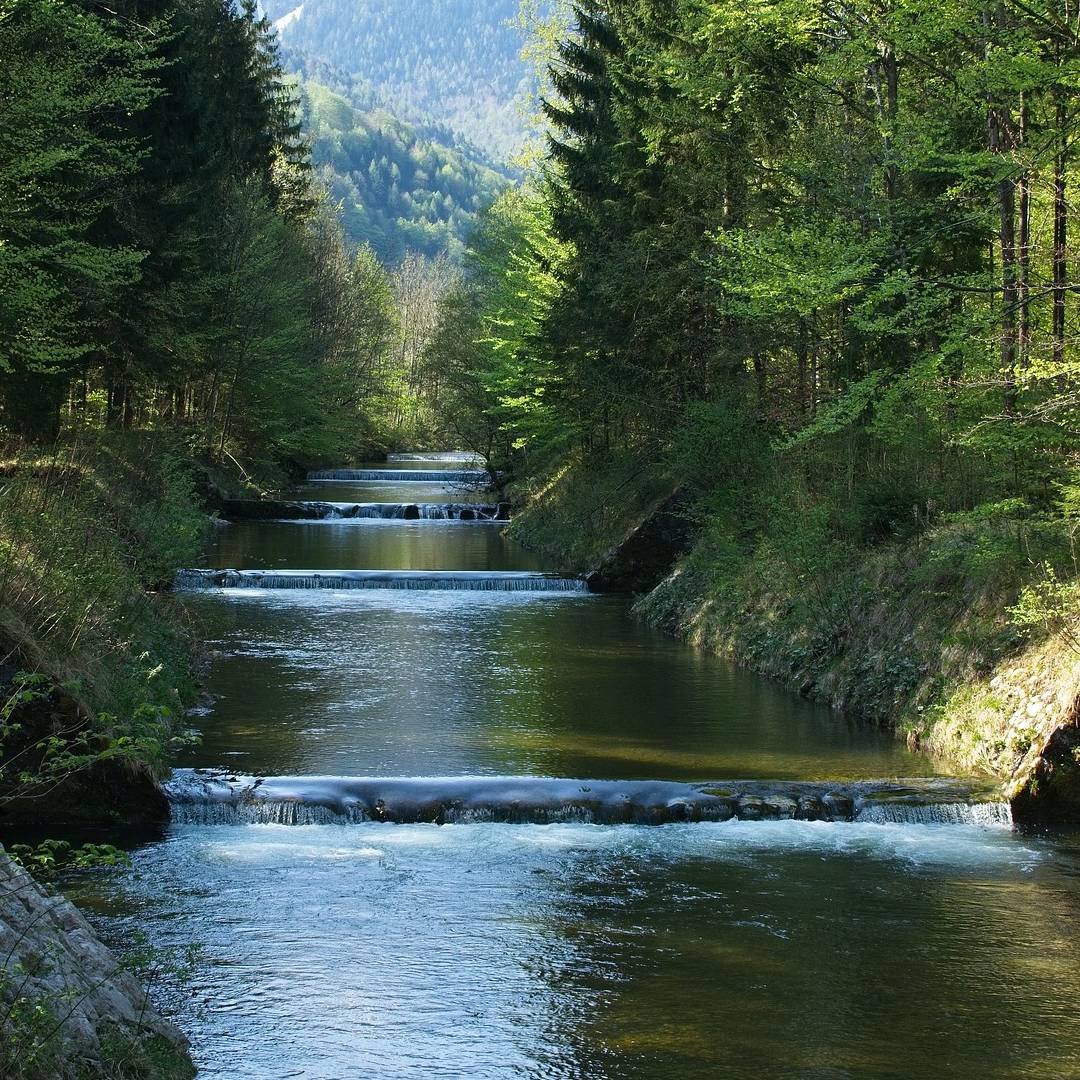
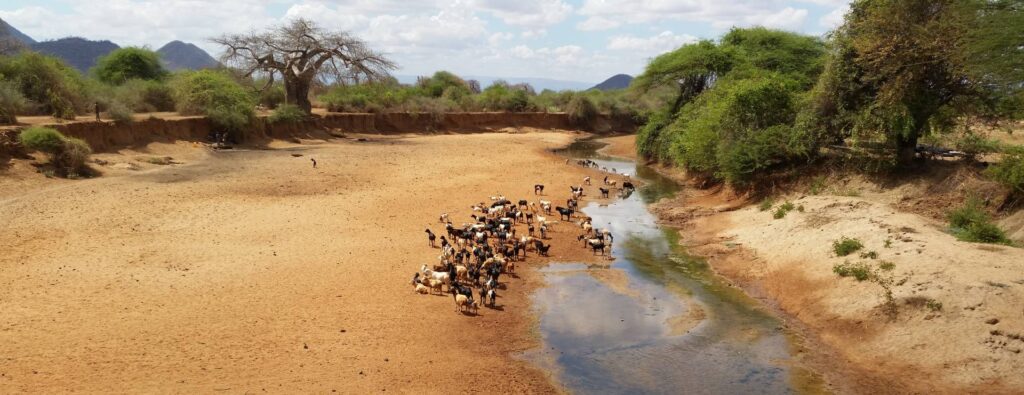
A natural river is inherently unstable. Uncertainties are concerned with:
- Climate: this is the dominant determinant of the rainfall regime and by extension of the natural vegetation cover of the landscape. Both are key factors in the rainfall-runoff process. A changing climate can profoundly affect the rainfall patterns, the rainfall-runoff response, the sediment load, and the hydrologic regime of the river.
- Land cover: a critical factor determining the rainfall-runoff response. It can change because of urbanization, deforestation, changes in agricultural practices, or climate change.
- Sediment load and particle size: the sediment regime of a river will be subject to change if the rainfall patterns and/or land cover in the catchment are modified. This will cause a geomorphological adjustment of the river, which would alter the stage-discharge relation if the control section is not anchored by bedrock, a hydraulic structure, or another stable constellation.
- Hydrologic regime: the combined factors of climate change and land-cover-change will modify the hydrologic regime of the river and probably also cause a morphological adjustment.
- Instable riverbed: all rivers are subject to morphological processes. While some hydraulic controls remain stable for extended periods of time—specifically those anchored by bedrock or a hydraulic structure—others are subject to continuous erosion or sedimentation.
Most of these key determinants of the behavior of natural rivers are subject to continuous and unpredictable change.
Additional uncertainties in rating curve development result from measurement errors and data scarcity. Measuring streamflow is difficult and subject to (unknown) measurement errors. For many hydrometric stations, there are insufficient data points and measurements are usually not available for the entire range of stage. Specifically, accurate flood measurements are routinely absent.
Summarizing the above, the contextual environment in which rating curves are developed is characterized by significant uncertainty.
When to apply a statistical method?
A statistical relationship is defined as “the association between two variables that is statistically significant.” Note that this does not necessarily imply a direct causal relationship.
Statistical techniques fit a mathematical relation—with one or more variables—through a set of past observations. When using enough variables, a very good fit can be obtained in most cases. The statistical relation (sometimes referred to as a ‘model’) is then applied for analyzing or predicting the future behavior of the system.
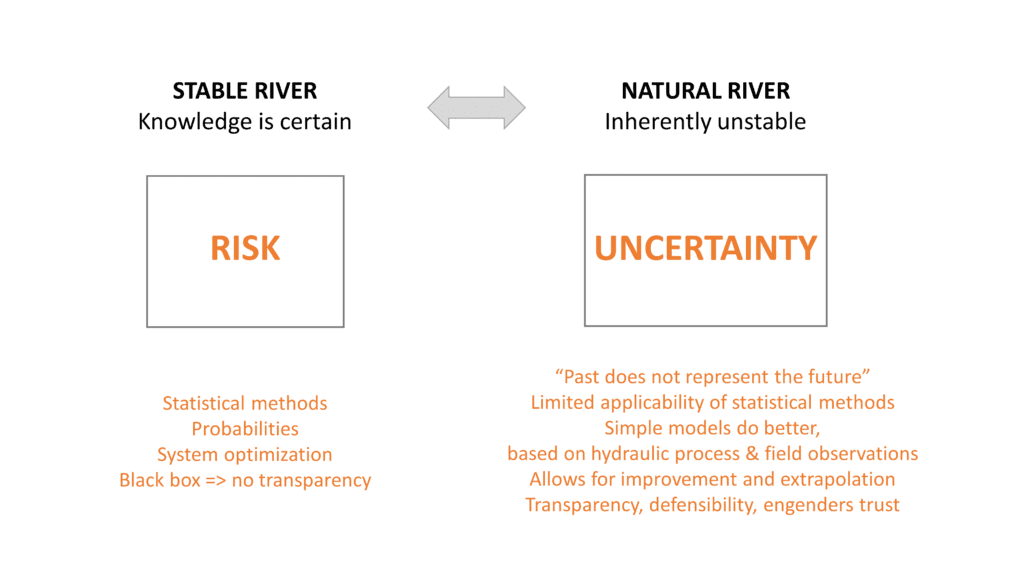
This approach works well in a stable environment, where past conditions represent the conditions of the future. In addition, the data set used to fit the relation/model needs to cover the entire range of state variables.
Disadvantages of statistical methods include:
- No transparency. The statistical method is effectively a ‘black box’ approach. It is therefore difficult to verify and/or defend the statistical relationship.
- It is not possible to extrapolate the statistical relationship to a range beyond the data set used to develop the relation.
- Measurement errors in the data set (used to develop the statistical relationship) will be perpetuated.
- A statistical relationship has no predictive power in an unstable environment.
When do statistical rating curves work?
Statistical methods for rating curve development are valid when:
- There is a stable control section.
- There is a stable hydrologic regime.
- There is an adequate set of error-free data for the entire range of stage.
I think the above conditions are only met in highly regulated rivers. It would imply that a statistical approach is not appropriate for most natural rivers.
Further, using a complex statistical method (e.g. the Markov Chain Monte Carlo technique) requires specialist input that may not be readily available at the field offices of a water resources agency.
The hydraulic approach in an unstable environment
In an environment characterized by uncertainty, a simple model that accurately represents the actual physical processes often works best. In case of the rating curve, and for most hydrometric stations, this is the “hydraulic approach.” This method uses field observations of channel properties to infer the coefficients of a standard rating equation. The conceptual rating curve is subsequently validated and calibrated with the available stage-discharge data points. A synopsis of the method is presented below.
A final comment. Even though some statistical methods use hydraulic variables, it still concerns a statistical relationship (in contrast with a hydraulic relationship). Thus, these methods have no predictive power and are only valid for the time frame that represents the data set used to fit the curve. Unless, of course, we are dealing with a regulated highly stable river.
A synopsis of the Hydraulic Approach to rating curve development
The hydraulic approach is based on the ‘standard rating equation’. This formula is derived from the Manning equation and describes uniform and steady flow in a wide river (i.e. 2h+w ~ w). Most natural rivers in their middle or lower reach are classified as ‘wide’.
The hydraulic approach assumes that streamflow is a function of water level. This is true when: 1) pressure head is the dominant term in the specific energy equation (thus, the velocity head v2/2g is negligible relative to the pressure head h), and 2) for critical flow (Froude number Fr = 1). These conditions are met for most well-selected hydrometric stations.
The standard rating equation is depicted in the below formula:
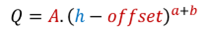
In which:
Q = discharge
h = water level
A = scale factor, which contains information about the channel slope, roughness of the bed material, channel width, channel sinuosity, and channel complexity.
Offset = this is a correction factor for determining the “point of zero head”, which represents the stage level where the sum of the forces that drive flow are zero.
a = velocity exponent; it represents the relation between stage (h) and stream velocity.
b = area exponent; it represents the relation between stage (h) and cross-sectional area.
The four coefficients (A, offset, a, and b) are inferred from field observations of channel properties and therefore represent physical parameters (rather than statistical ones). The resulting conceptual rating curve is falsified and calibrated with historic and current discharge measurements.
The physically-based structure of the standard rating equation—where the coefficients are based on field observations of physical parameters—carries many advantages. These comprise:
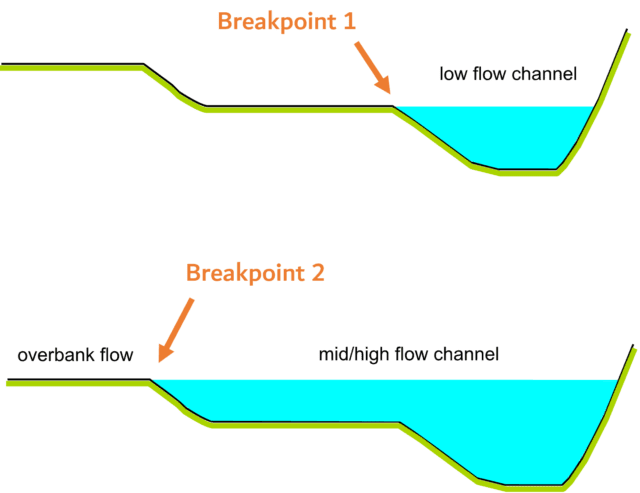
- The location of breakpoints in a multi-segment rating curve can be identified during a field visit. For example, a breakpoint will occur with an abrupt change in channel geometry. This happens when the river overflows its banks or leaves the low-flow channel. Another example of a breakpoint is the stage when a small obstacle that controls low flows is submerged with rising water levels.
- In the event of a dynamic channel—because of erosion or sedimentation—the respective coefficients of the rating curve that describe the adjusted riverbed can be modified as a function of the observed changes. For instance, field hydrologists can measure the change in riverbed geometry with a cross-sectional survey and adjust the offset and area exponent accordingly.
- The extrapolation range is explained by the conceptual rating model and no longer governed by an arbitrary rule (such as “do not extrapolate beyond two times the maximum measured discharge”). For example, extrapolation is justified up to the point where overbank flow occurs.
- A skilled hydrologist can predict changes in the rating curve based on observed or anticipated changes of the hydraulic control. It increases the confidence we have in the rating curve and the derived discharge time series.
- Because the rating curve coefficients are based on physical (observable) parameters, the curve can be explained and defended to outside parties. It increases transparency and the confidence stakeholders have in the water resources management process.
REFERENCES
Sajjad M. Vatanchi, Mahmoud F. Maghrebi; Estimating streamflow by innovative rating curve model based on hydraulic parameters; 2024, Springer Nature
J. Michael Johnson, Shahab Afshari, and Arash Modaresi Rad; AHGestimation: An R package for computing robust, mass preserving hydraulic geometries and rating curves; JOSS The Journal of Open Source Software; 2024
This post is part of a series on “defensible water data”.
Other posts in this series are:
- A new tool for the hydrometric toolbox: monitoring river discharge from space
- Defensible discharge data
- A roadmap to defensible streamflow data
- Better water data by stabilizing the low flow control
- Reviewing a video of flood flows at Rio El Piro hydro station
- The fast lane to better water data