Developing rating curves is a recurrent theme on this blog. The rating curve is the unique relation between stage and discharge at the control section of a hydrometric station. For many field conditions—specifically in a data scarce and dynamic environment—the ‘hydraulic approach’ provides an effective solution. This method uses field observations of channel properties and flow conditions to infer the coefficients of the standard rating equation. The conceptual rating curve is subsequently validated and calibrated with the available stage-discharge data points.
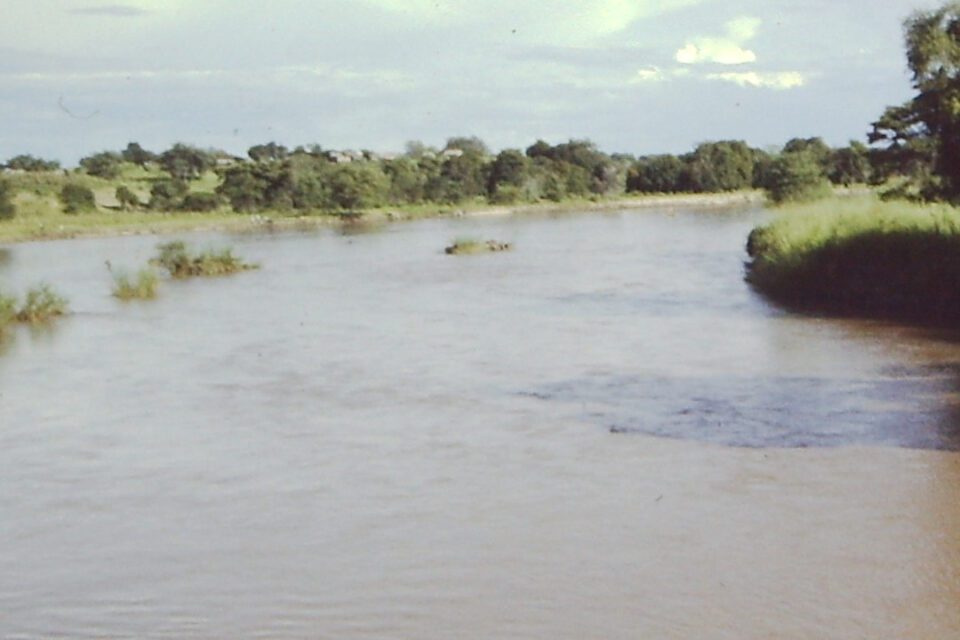
This post will present an example of the rating curve for Momba river in the Lake Rugwa basin in Tanzania. Discharge data are available from 2021 to 2024.
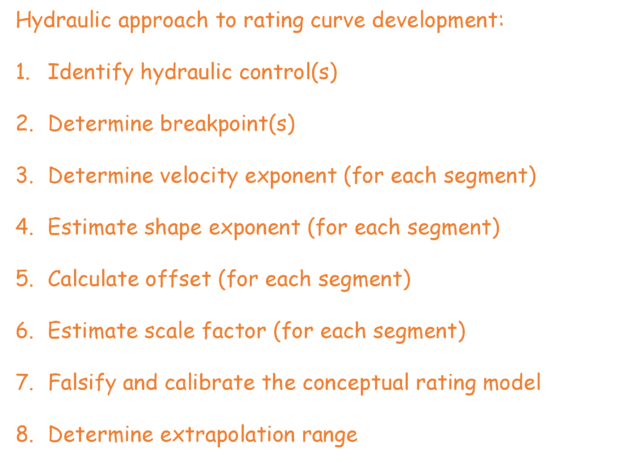
Control Section
The first step of the approach is to analyze the hydraulic control. Most controls of natural rivers are complex. It implies that a change in hydraulic conditions leads to a break in the rating curve and that the stage-discharge equation comprises multiple segments.
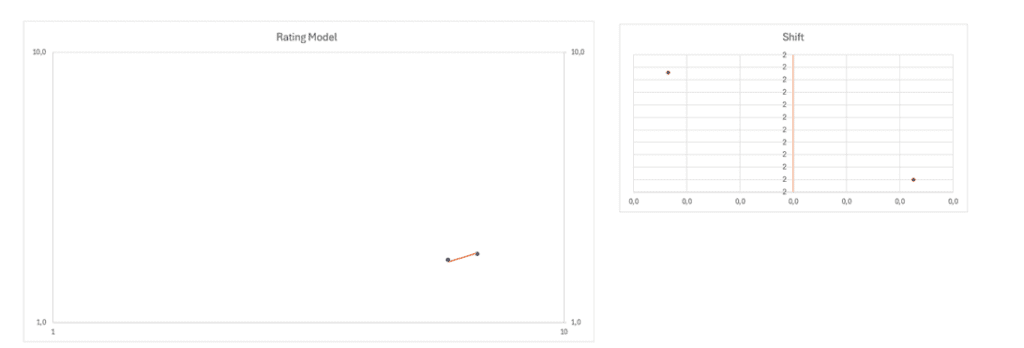
The cross-sectional profile of the hydraulic control for Momba river gauging station 3B2 is presented in figure 1. It suggests 3 breakpoints—at stage levels 2m, 3.2m, and 5.2 m. In this specific case, however, a fourth breakpoint was added at 1.8m stage level. This was necessary because the available discharge measurements in the segment 1.8-2.0 m did not match with the data in either the segment below or above (fig 2). A possible explanation is that flow transitions from ‘section control’ to ‘channel control’ in this zone.
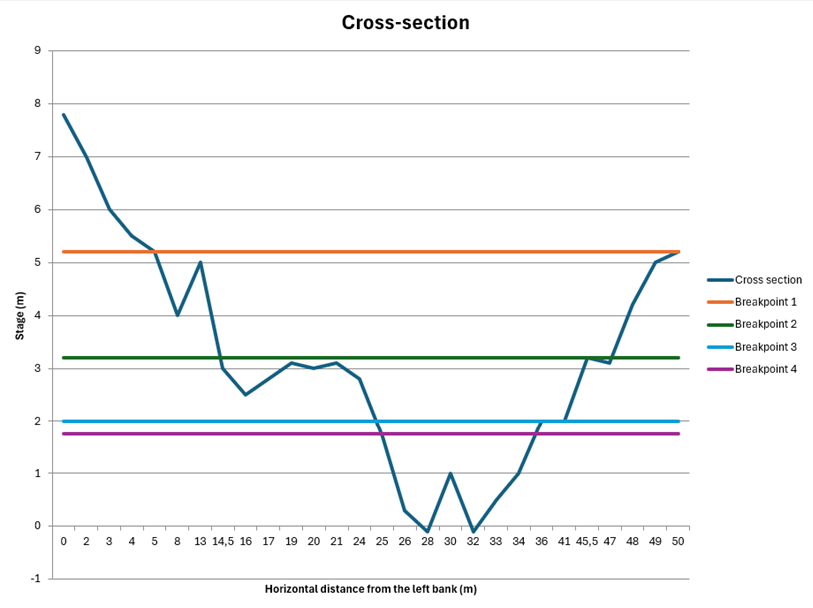
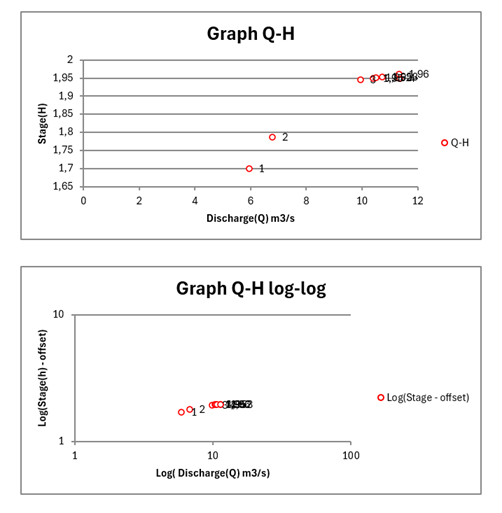
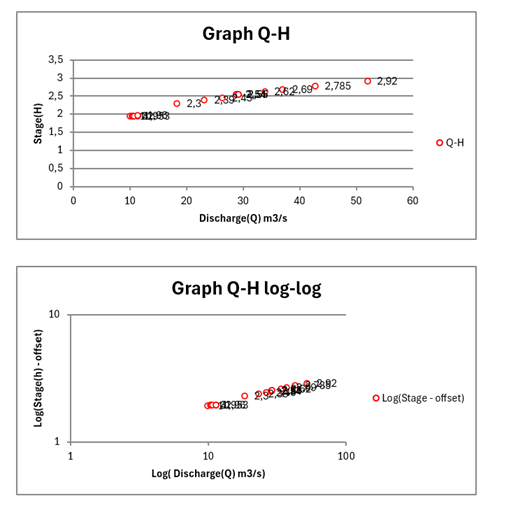
Fig 2: discharge data in segment 1.8-2.0 m compared with the segments above and below
Conceptual Rating Curve
Channel properties and flow conditions provided clues for the coefficients of each segment of the rating curve. The offset was calculated by assessing the ‘point of zero head’ for each segment. Note that this differs from the ‘point of zero flow’ for all segments apart from the lowest. The resulting conceptual rating model is presented in the below table (the column headers are in Spanish…. but I think their meanings are obvious).

Historic and current discharge measurements are used to validate & calibrate the conceptual rating model. For Momba station, discharge data are available for the period 2021-2024.
The coefficients of the final rating curve are presented in the table below. Note that segment 1 has not been calibrated because not enough stage-discharge data pairs were available. Instead, the coefficients of this segment are based on the hydraulic characteristics of the control section only. The resulting rating curve—together with the existing stage-discharge data pairs—is presented in figure 6.
| Seg no. | Range | Offset | Exp | Scale Factor | Comments |
| 1 | -0.1 – 1.8 | 0 | 1.75 | 2.35 | Not enough data to accurately fit this segment (fig 3); nevertheless, the coefficients are in line with the theoretical values. It is necessary to organize a dedicated measurement campaign for this segment. It was not possible to combine the range -0.1-2.0 into a single rating curve (see fig 2). |
| 2 | 1.8 – 2.0 | 0.65 | 1.85 | 5.5 | A separate segment was needed for the range 1.8-2.0; the existing data points in this range did not fit the curve above or below (see fig 2). The curve has been constructed as a transition between segment 1 and 3. With offset = 0.65 and exp = 1.85. |
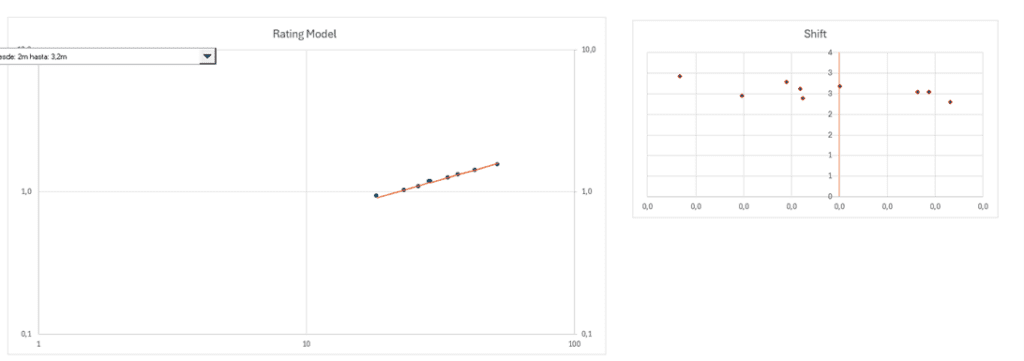
| 3 | 2.0 – 3.2 | 1.37 | 1.87 | 22 | The log-log plot for segment 3 is presented in fig 4. |
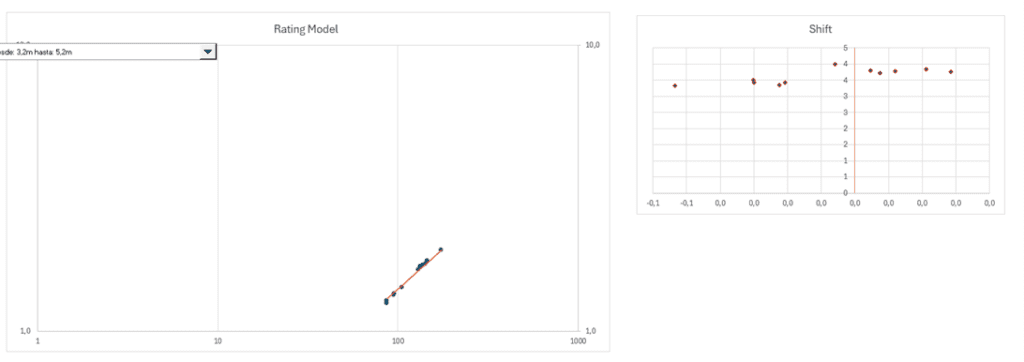
| 4 | 3.2 -5.2 | 2.08 | 1.78 | 54.5 | The log-log plot for segment 4 is presented in fig 5. This segment can be extrapolated up to 5.2 m stage level (see fig 1). |
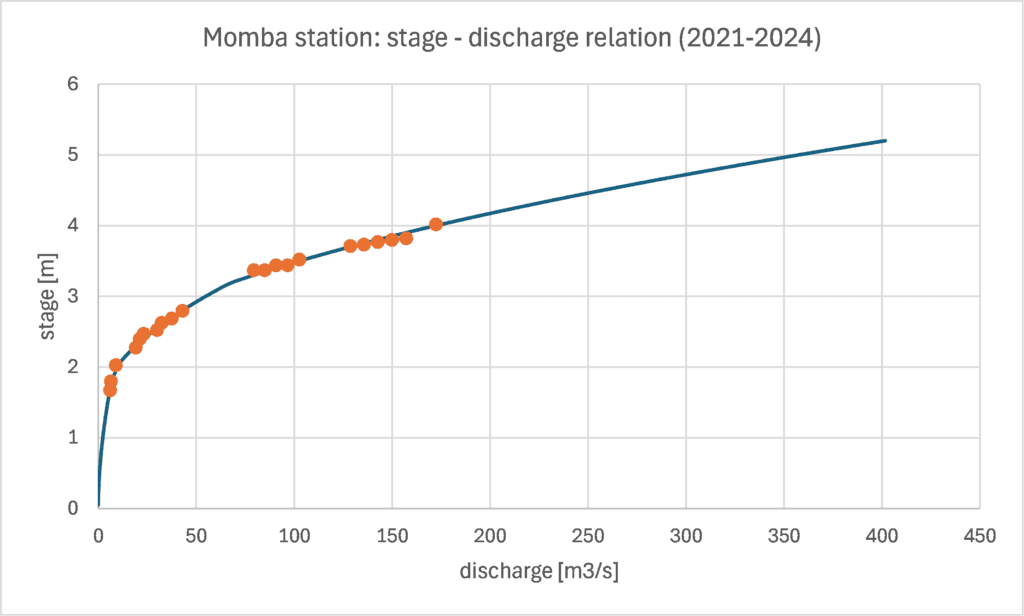
A very reasonable fit between the rating curve and the available stage-data pairs has been obtained (fig 6). The coefficients of the curve correspond to the hydraulic characteristics of the control section, suggesting a robust and plausible curve. We have good confidence in segments 2-4 of the curve, while segment 1 has been classified as ‘estimated’. Hence a dedicated measurement campaign is needed to confirm this segment (from -0.1 to 1.8 m). The curve can be extrapolated up to 5.2 m stage level. A measurement of the cross-sectional profile of the right bank (above 5.2m stage level) is needed if the curve should be extended beyond 5.2m.
Closing Comments—The Rating Curve Toolbox
In this specific context—characterized by an irregular control section with changing flow conditions—the hydraulic approach proved useful. A plausible rating curve was developed that is defensible. Optimal use was made of the limited set of stage-discharge data points. Additional information was provided by the cross-sectional profile and the observations about the hydraulic conditions of the river during low flows. Further, the approach made it possible to clearly identify the extrapolation range, while it also informs a strategic field monitoring program.
Given the irregularity of the hydraulic control—which resulted in 4 break points in the rating curve—it is unlikely that a statistical analysis would have been able to capture the transitions in the rating curve. That would have required much more field data, which is not feasible for this remote site. Hence Momba station 3B2 provides a good example of where the hydraulic approach to rating curve development is effective. For the Momba conditions, it was the right tool to select from the Rating Curve Toolbox.
This post is part of a series on “defensible water data”.
Other posts in this series are:
- Defensible discharge data
- Developing rating curves: the “hydraulic approach” versus complex statistical methods
- A roadmap to defensible streamflow data
- Better water data by stabilizing the low flow control
- Reviewing a video of flood flows at Rio El Piro hydro station
- The fast lane to better water data
1 comment on “Case study: rating curve for Momba hydrometric station”Add yours →
Comments are closed. You can not add new comments.